
Why You Need a Custom Dashboard
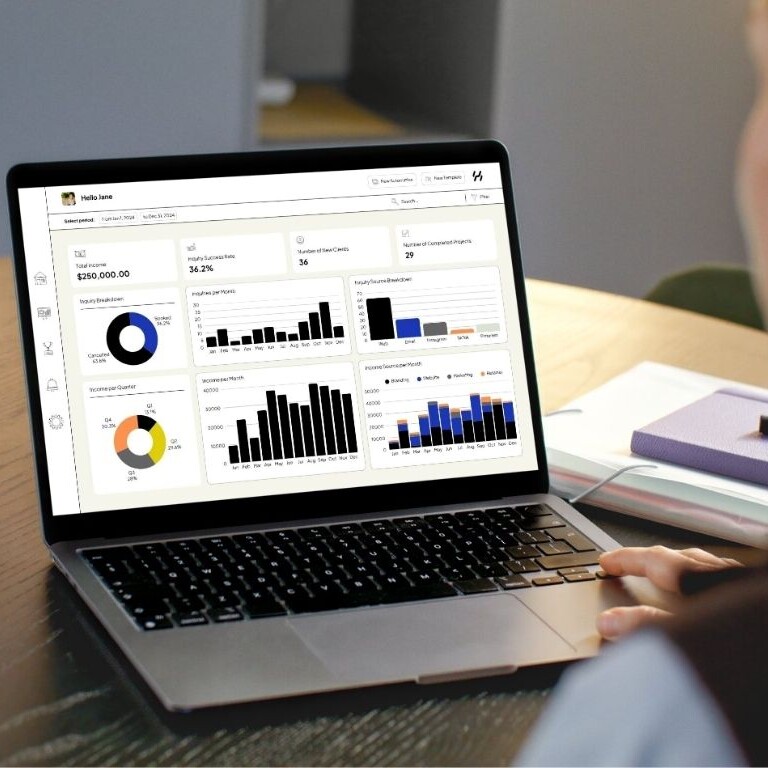
Click to Experience Dashboard
Signs You’re Drowning in Data Chaos:
- Your team argues over which numbers are correct
- You spend more time building reports than analyzing them
- Leadership can’t see the connection between marketing and revenue
- You’re missing opportunities because insights are buried in spreadsheets
What Disconnected Data Costs You:
- Missed trends (slow to spot rising CPAs or dropping conversion rates)
- Wasted time (manually stitching together reports every week)
- Poor decisions (optimizing based on incomplete or outdated data)
Our Dashboard Development Process
01
Discovery & Goal Alignment
- Identify your key business questions (“What’s our true CAC by channel?”)
- Audit all data sources (ads, CRM, web analytics, etc.)
- Map user roles (executive vs. specialist views)
02
Design & Build
- Consolidate data in a Data Warehouse
- Create intuitive visualizations (not just pretty charts – actionable ones)
- Connect to your stack (Google Analytics, Meta, HubSpot, etc.)
- Set up automated refreshes (no more manual updates)
03
Launch & Train
- Deploy with your team (Slack/MS Teams integrations available)
- Integrate Conversational Analytics so you can ask your dashboard important questions and get answers instantly (Optional)
- Train users on how to find and act on insights
- Optimize based on feedback
What You'll Get
Get a Free Consultation Today!
Why Clients Choose Us
We design dashboards to answer business questions, not just display charts.
We work with your stack: Looker Studio, Power BI, Tableau, or custom builds.
From kickoff to launch in 2-4 weeks.
Monthly check-ins to ensure accuracy and add in any new data sources/ requirements.
Platforms We Work With