

See the paths people take to convert.
Pathwise reads your GA4 data from its BigQuery export and turns every session into a journey you can follow. See which paths lead to a goal, where people drop off, and how one group behaves against another.
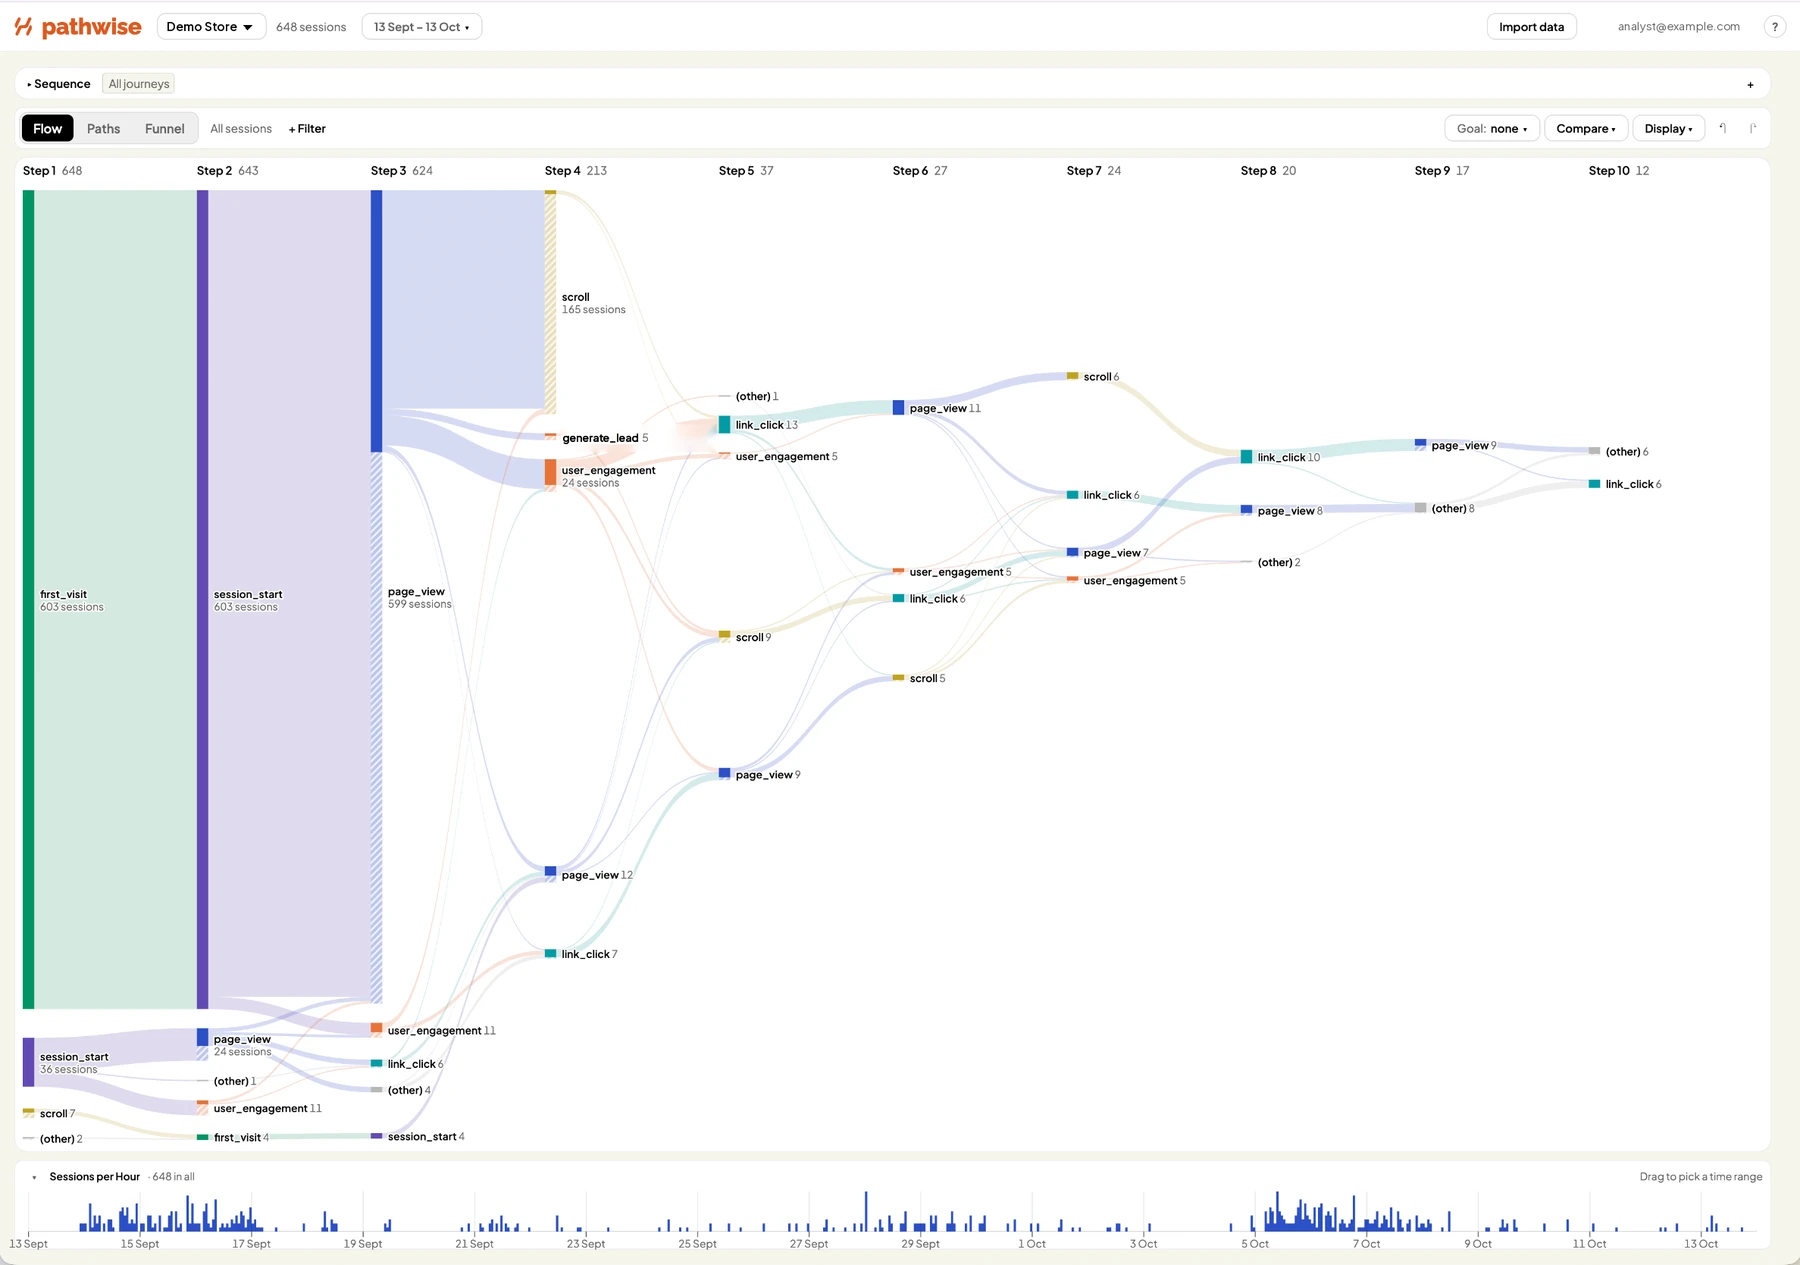
Flow view, 30 days of sessions
Questions it answers
Reports count what happened. Journeys show the order it happened in.
Pathwise puts every event in the order people did it, so you can see what they did before they converted and what they did instead. That makes it a practical way to improve the user experience and usability of your website: you see where people get stuck, go back on themselves or leave, and you can check whether a change fixed it.
What do people do right before they submit a lead form?
Answered with Focus on event, which shows what happened before and after any event.
Where do mobile visitors leave that desktop visitors do not?
Answered with Segment comparison and Exits, side by side.
Which journeys end in a purchase, and which end in an exit?
Answered with Goals and the Paths view, with conversion and lift for each path.
Exploring journeys
Follow any journey from the first event to the last.
Flow diagram
How users move from event to event within a session.
- Drill into any step
- Start or end the diagram at an event, or keep only sessions that pass through it
- Hide, group or split steps, for example by page
- Group similar pages under one label
Goals and exits
Pick a goal event and see what leads to it.
- The paths that lead to the goal, with conversion rate and lift over the average
- Where users drop off, compared with where they reach the goal
Paths and funnels
The complete journeys, and the stages inside them.
- The most common complete journeys, with share, duration and conversion
- Multi-stage funnels with conversion and the time between stages
- Where people went instead when they dropped out of a funnel
Segments and sequences
Narrow the journeys down to the ones that matter.
- Compare 2 groups side by side: mobile and desktop, paid and organic, new and returning, or converters and everyone else
- Keep only sessions that follow a set order of steps, immediately or eventually
- Exclude sessions that follow a pattern
- See what happened before and after a key event
Charts and filters
Click a chart and everything else filters with it.
- Activity over time, and who reaches each step by device, country and source
- Time between steps and value distributions
- Filters for date and time, device, country, source, medium, campaign, and whether a session has a given event
Sharing
Built for working through a question with your team.
- Share any view as a link
- Undo any action
- Keyboard shortcuts for most actions
Getting data in
From your GA4 BigQuery export to your first journey in 3 steps.
Connect your BigQuery export
Sign in with Google and choose the BigQuery dataset your GA4 property exports to. Pathwise checks your access and shows a cost estimate for the import before you commit.
Choose the event details
Keep the event details you need and leave out the rest.
Keep it current
Refresh with new days, extend the date range, or schedule a daily refresh.
Pair it with Lumen
A journey is only as reliable as the events behind it.
Pathwise shows how people move through your site. The Lumen audits confirm the events those journeys are built from are tracked correctly.


Early access
Request early access to Pathwise.
Pathwise is in early access. Join the waitlist and we will be in touch to connect your GA4 BigQuery export.
No spam. We will reach out when your spot is ready.